Designing for Decision
When you're a Tier-1 supplier to powerhouses like Ford, GM, and Mazda, speed and compliance aren’t just nice to have—they’re non-negotiable. As NRB Bearings rapidly scaled its global footprint, the leadership faced a classic challenge: how do you stay nimble, make smart decisions fast, and still uphold the rigorous standards of the automotive industry?
This is the story of how I designed a decision-making dashboard—not just a metrics display, but a strategic intervention tool built for clarity, agility, and insight.
Problem
NRB had recently rolled out an NPD (New Product Development) platform to digitize quoting and documentation. It was a huge leap forward from the email-driven chaos of before. But digitization alone wasn’t the endgame.
What leadership needed wasn’t more data. It was the right data, at the right time, in the right format.
Approach
I kicked things off with deep listening—conducting in-depth interviews with VPs and managers to dig into their workflows, decision-making patterns, and frustrations with current data tools.
From there, I set a clear bar for effective visualizations, built around four key criteria: actionability (does it drive decisions?), clarity (is it instantly understandable?), usage frequency (will it be used daily or weekly?), and feasibility (can it be built with the existing data stack?).
Using these filters, I cut through vanity dashboards and focused on creating strategic tools designed for real-time use—not just for show.
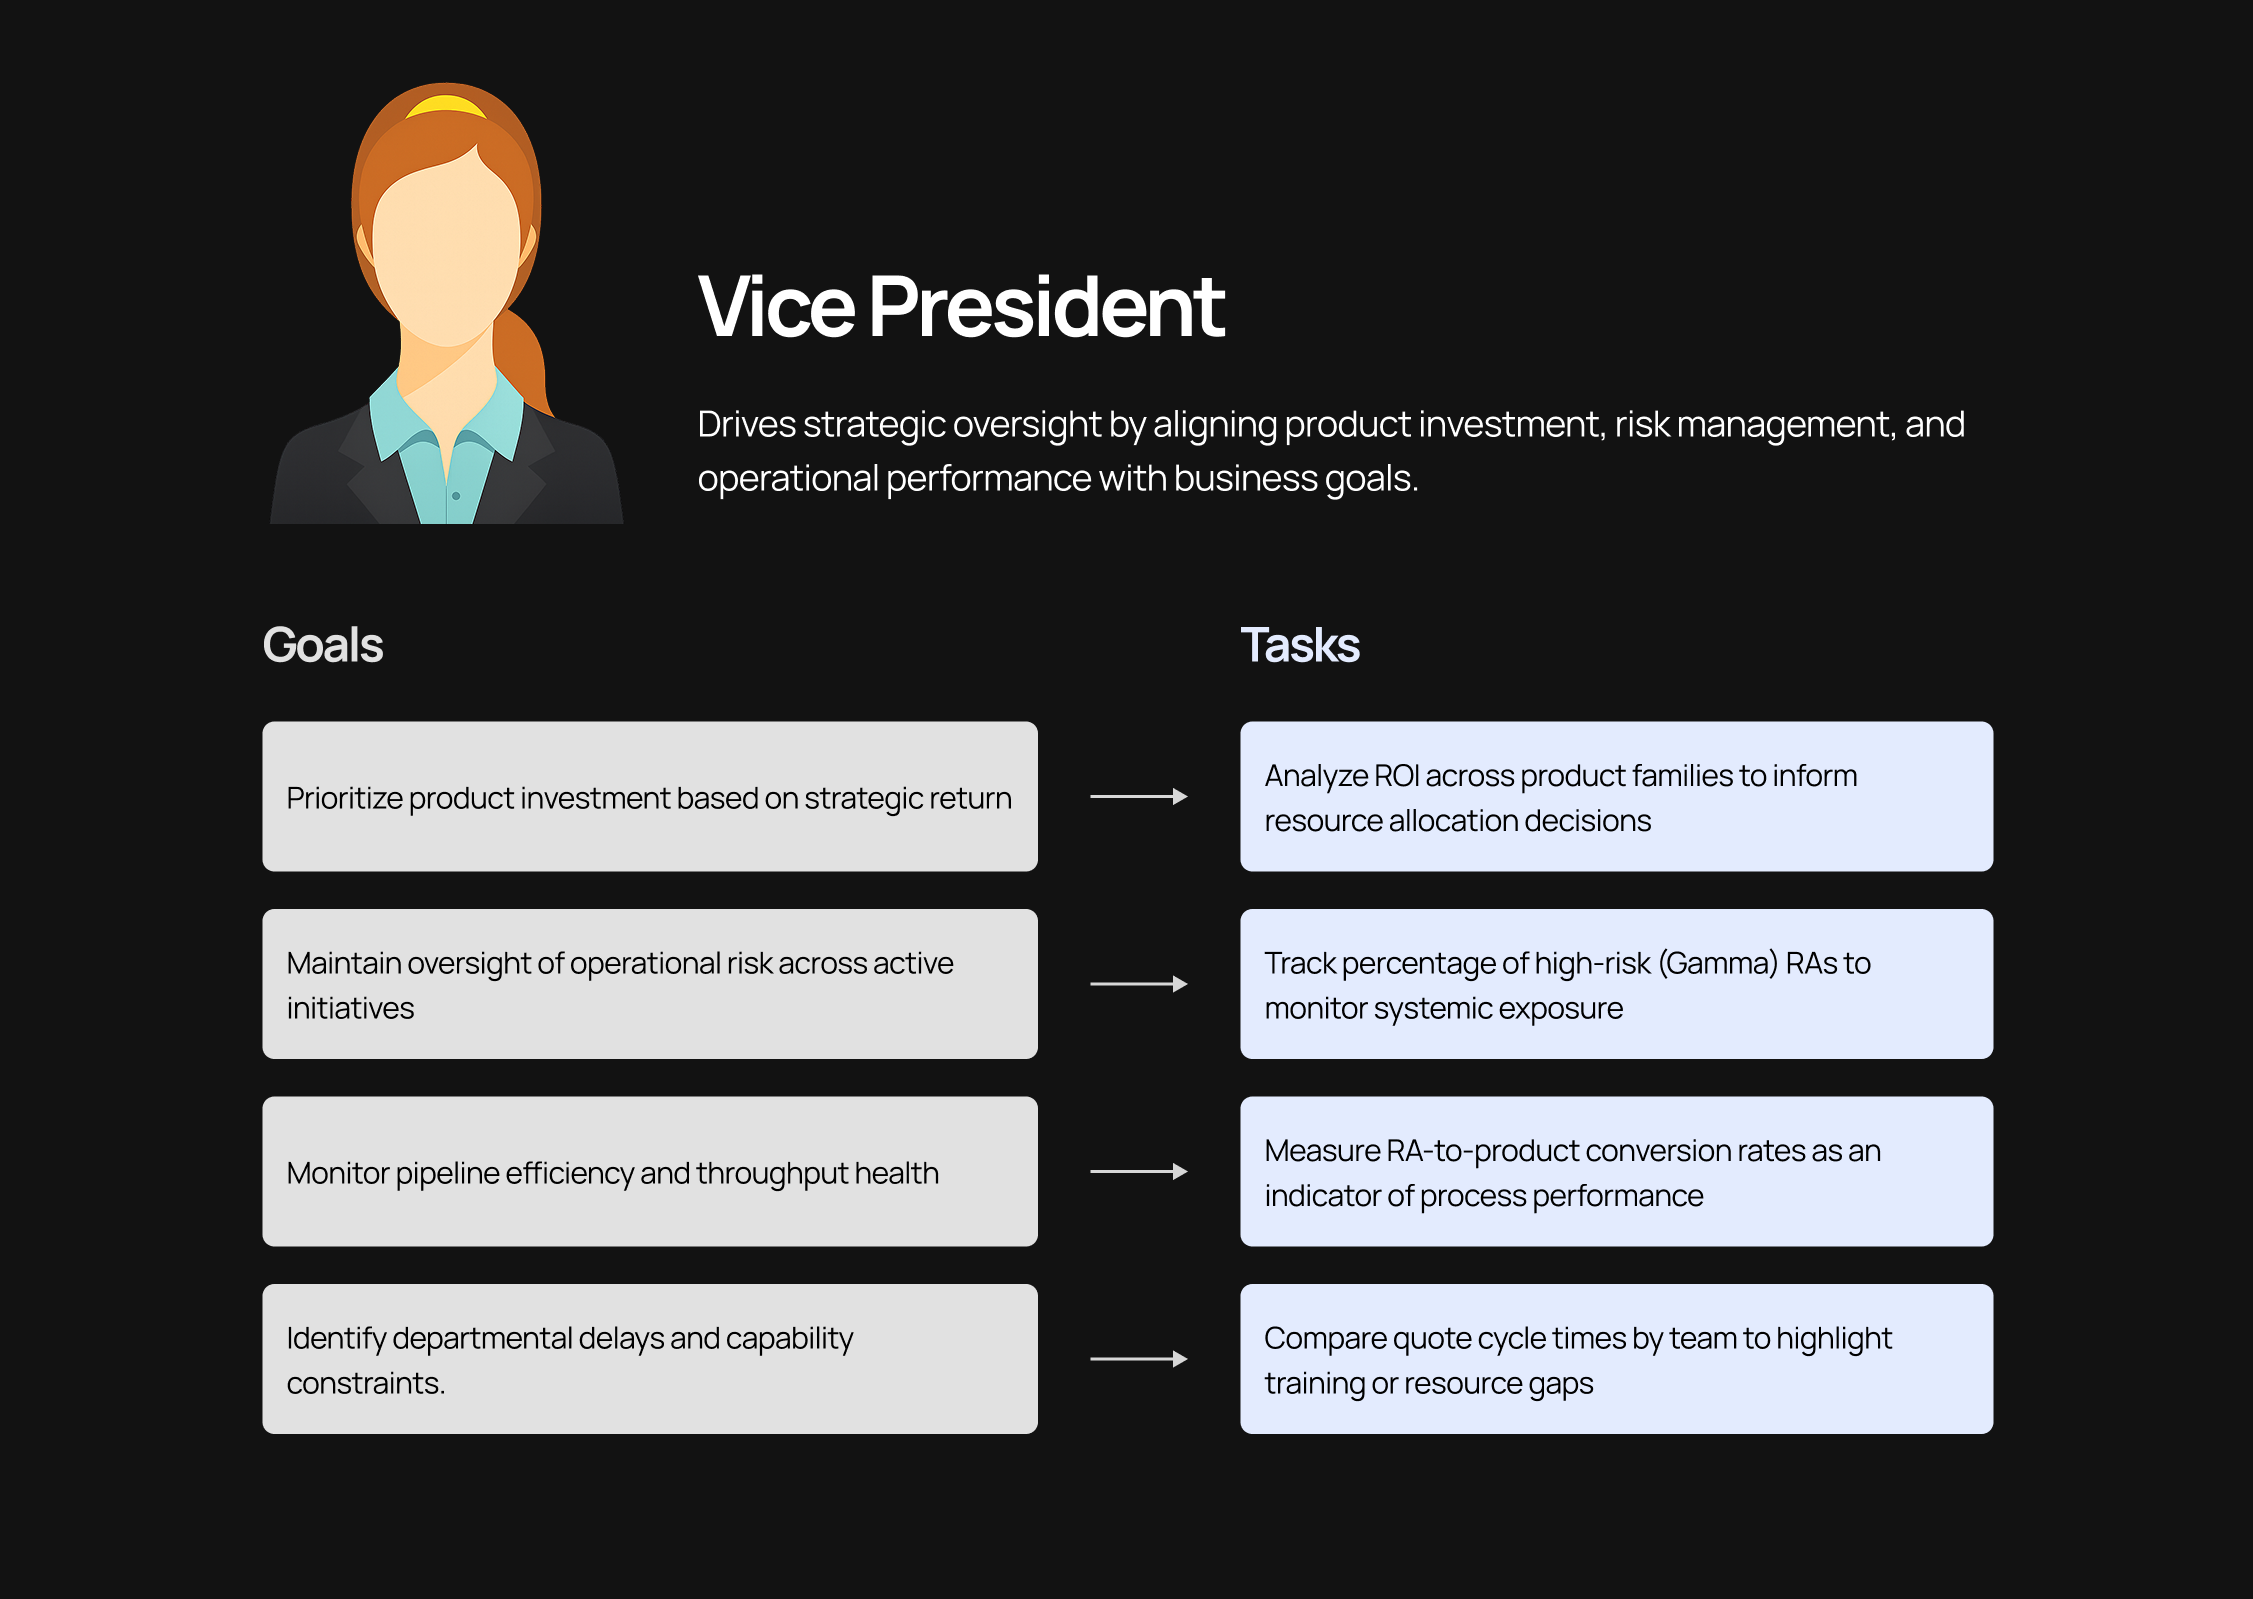
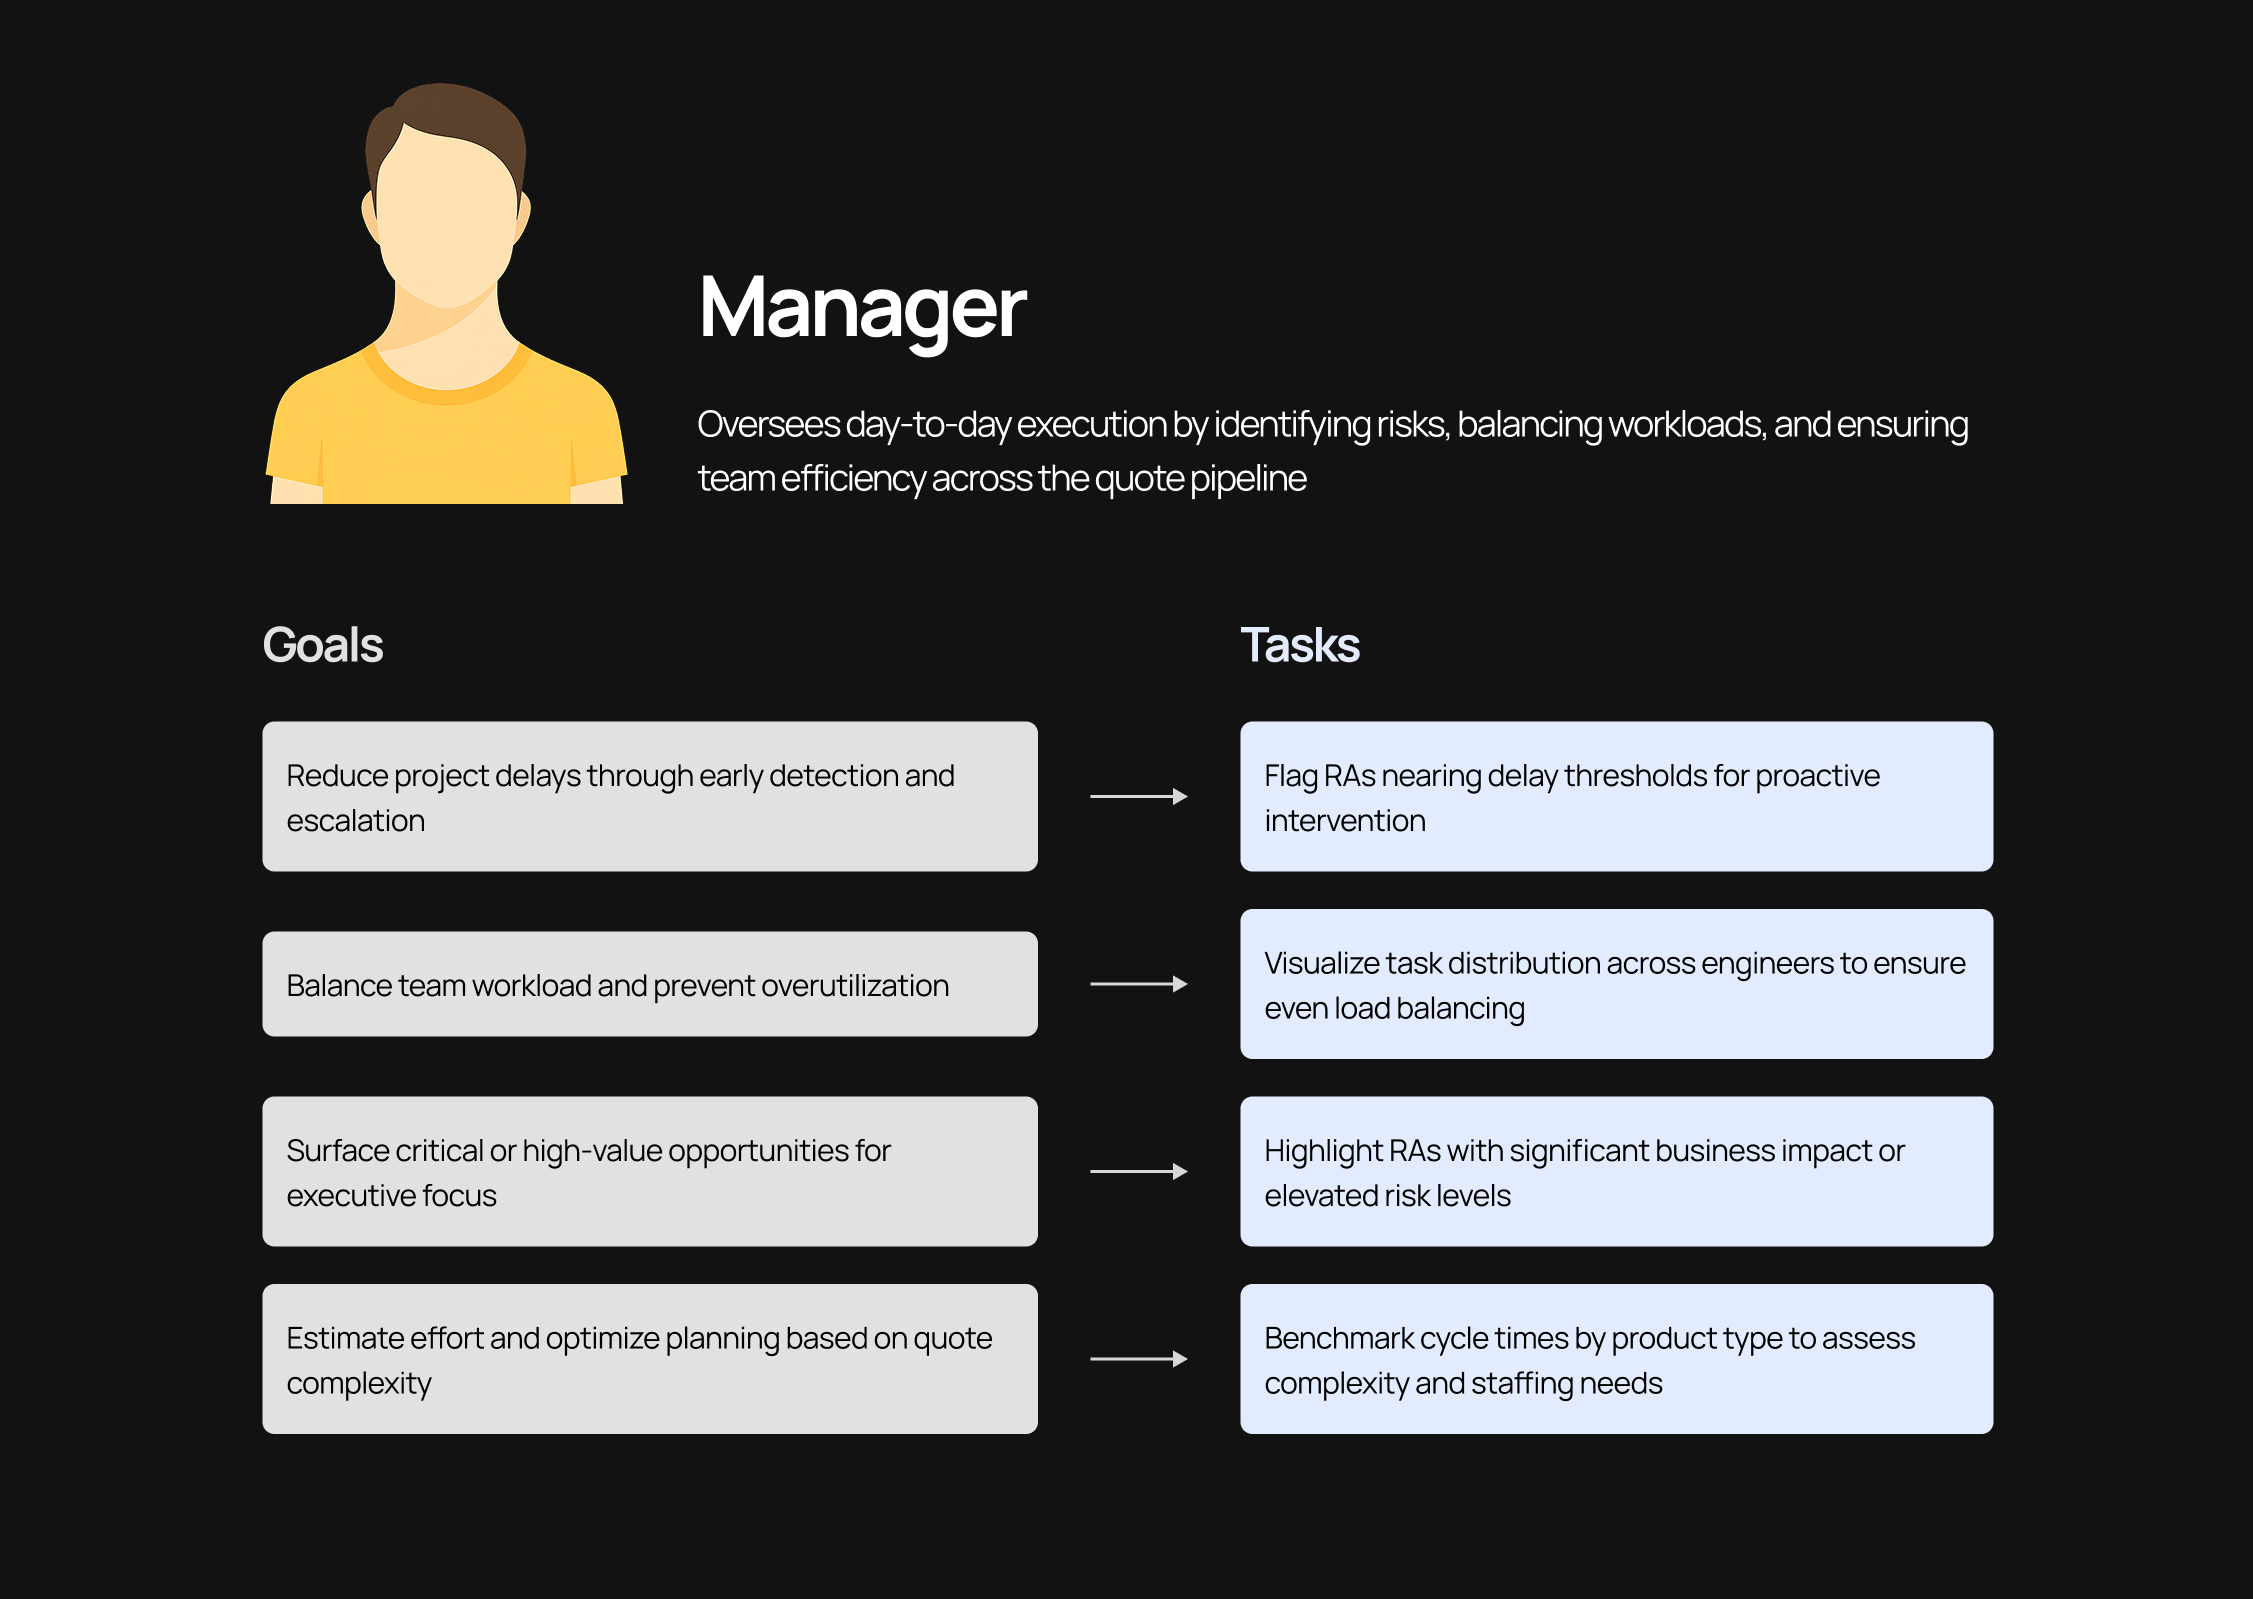
Mapping Business Goals to Data Tasks
With the new platform in place, NRB was generating structured data for the first time. But reporting was still primitive. The data existed—it just wasn’t telling a story.
So I went back to basics. I interviewed 30+ stakeholders across functions, asking
Which metrics do you currently refer ?
How often do you check them?
What data do you wish you had quicker access to?
Patterns emerged. Leaders didn’t want dashboards full of noise. They wanted strategic signals—clean, focused insights that made acting easier, not harder.
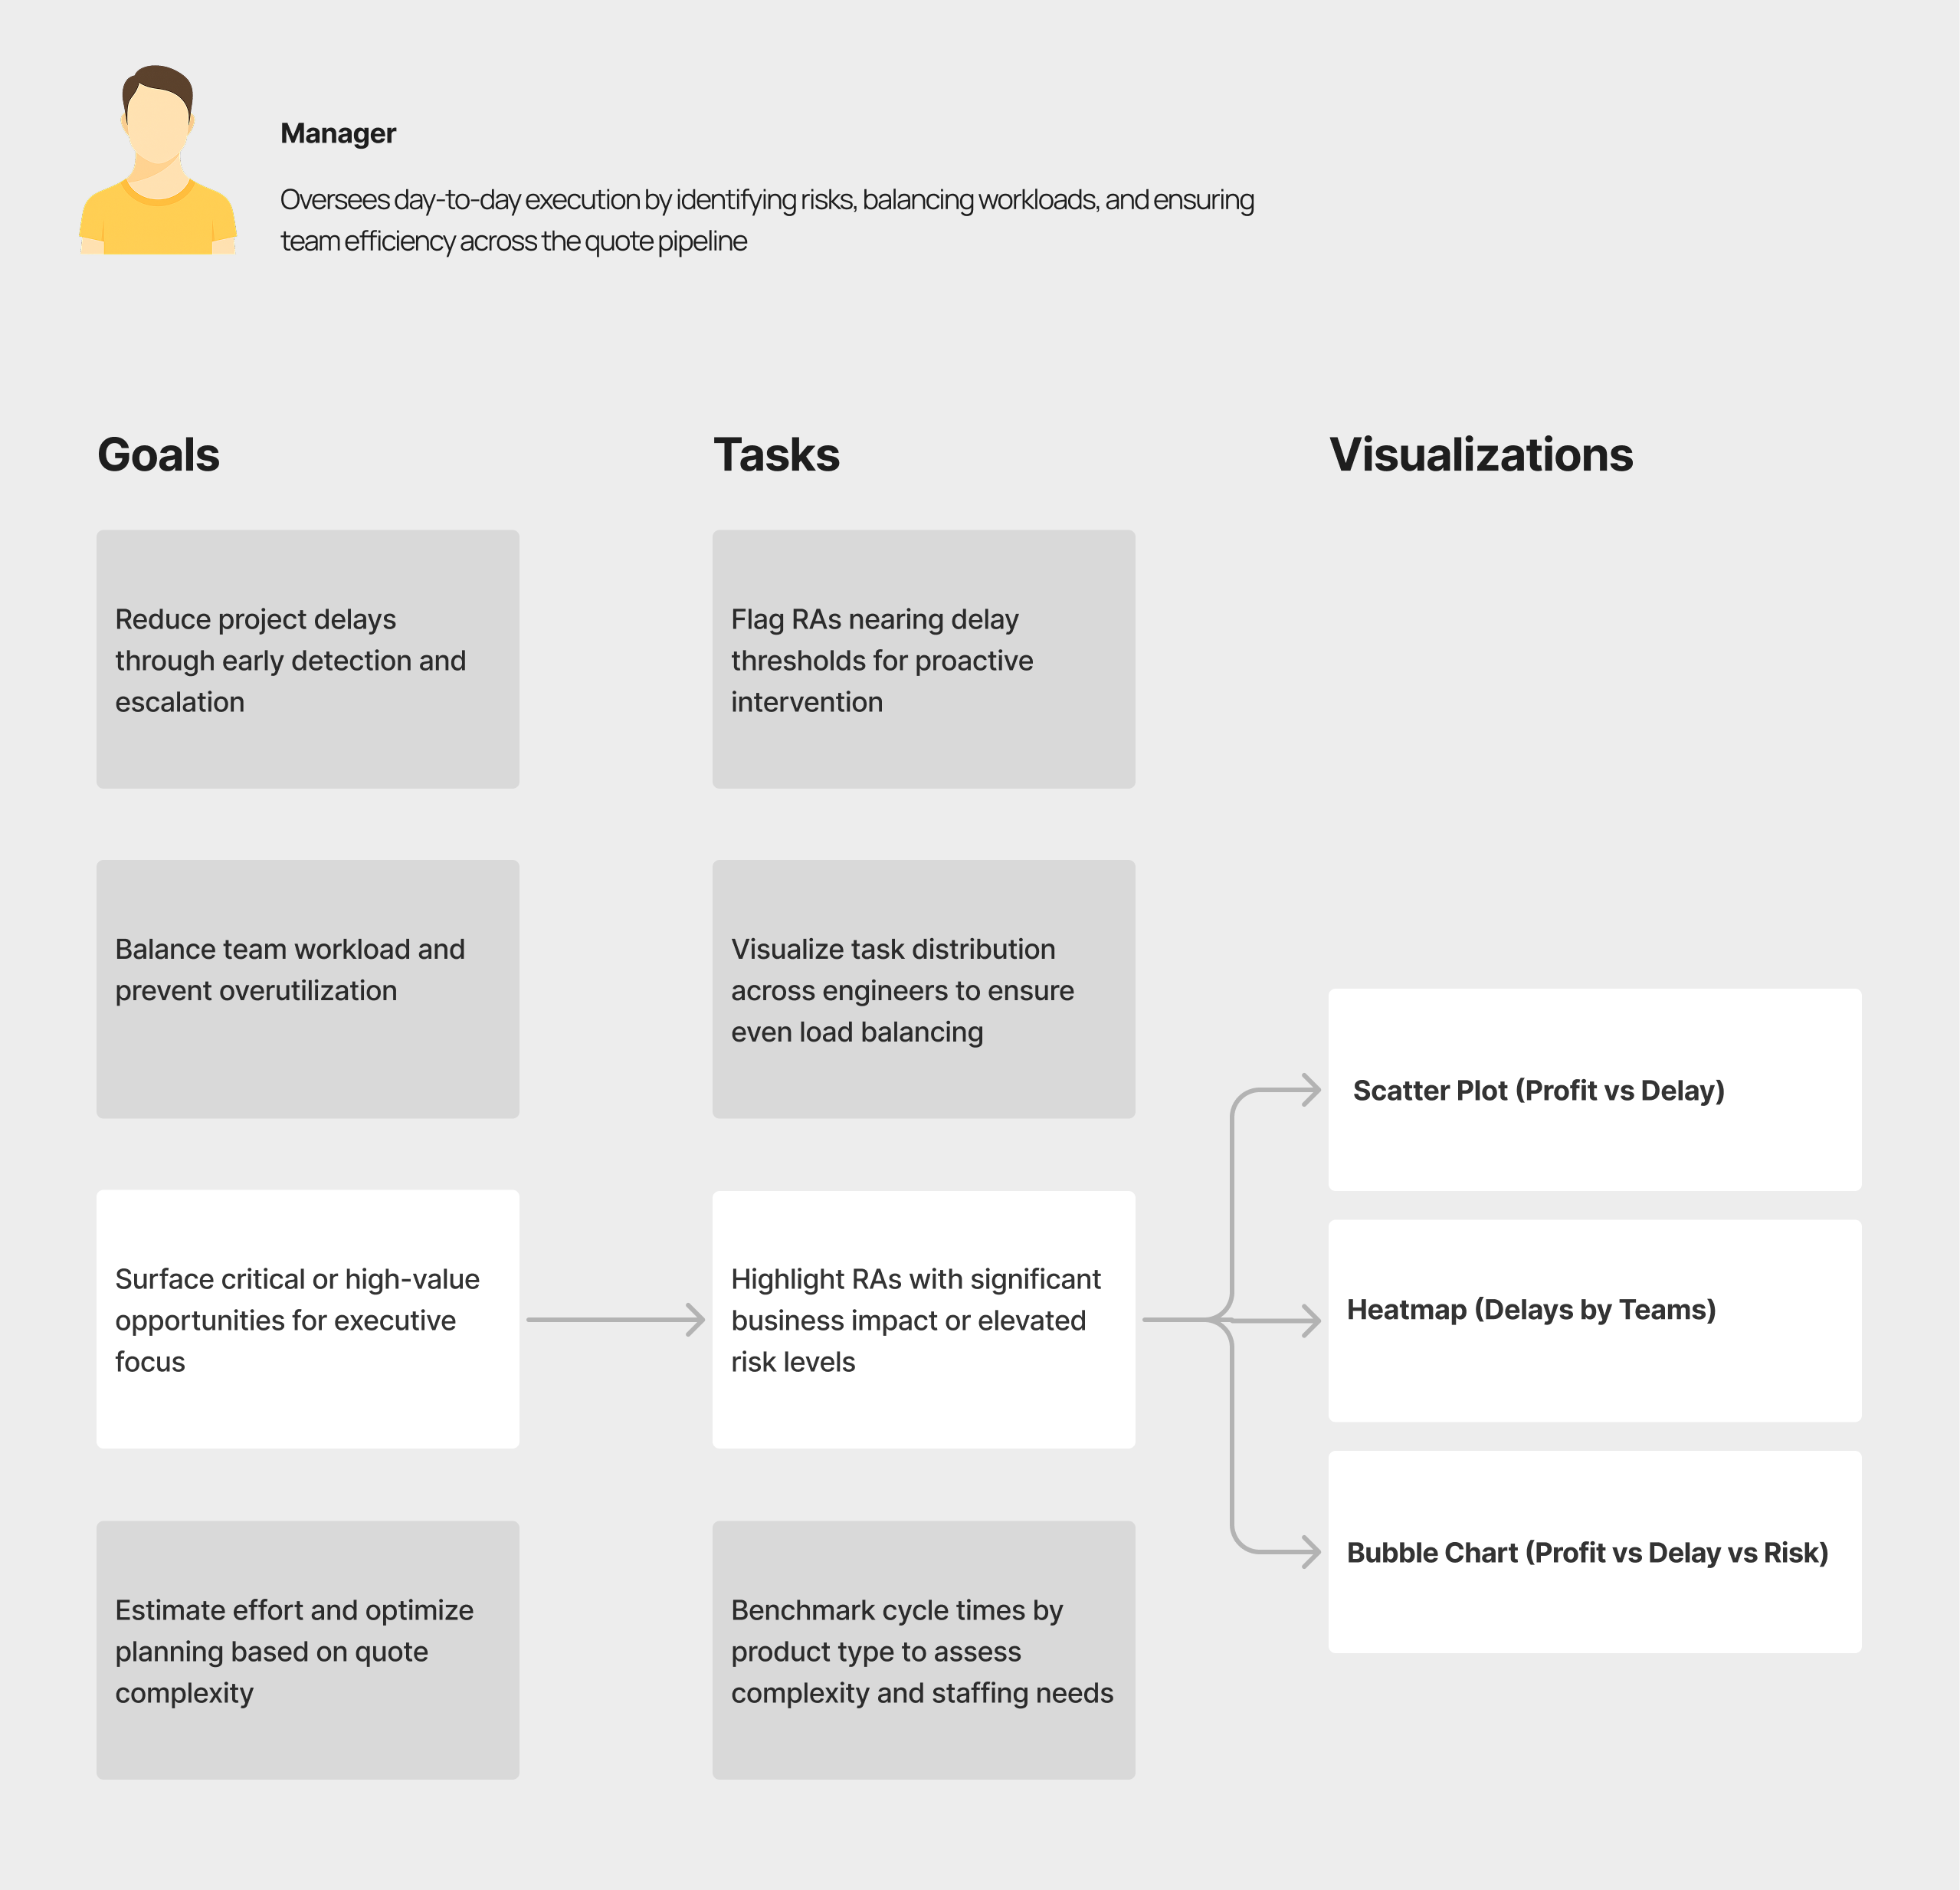
Making Visualization Choices
Designing effective dashboards isn't just about aesthetics—it's about choosing the right visual tools for the job. To ensure every chart we included added strategic value, we developed a scoring framework across four dimensions:
Actionability – Can users take immediate action based on this view?
Clarity – Is the chart intuitive at a glance?
Usage Frequency – Will it become a go-to for regular decisions?
Feasibility – Can it be realistically implemented with available data?
| Visualization | Actionability | Clarity | Frequency | Feasibility | Total | |
|---|---|---|---|---|---|---|
| Scatter Plot | 2 | 3 | 2 | 3 | 10 | ✗ |
| Heatmap (Delays by Teams) | 2 | 2 | 3 | 2 | 9 | ✗ |
| Bubble Chart (Profit vs Delay vs Risk) | 3 | 3 | 3 | 2 | 11 | ✓ |
Similarly...
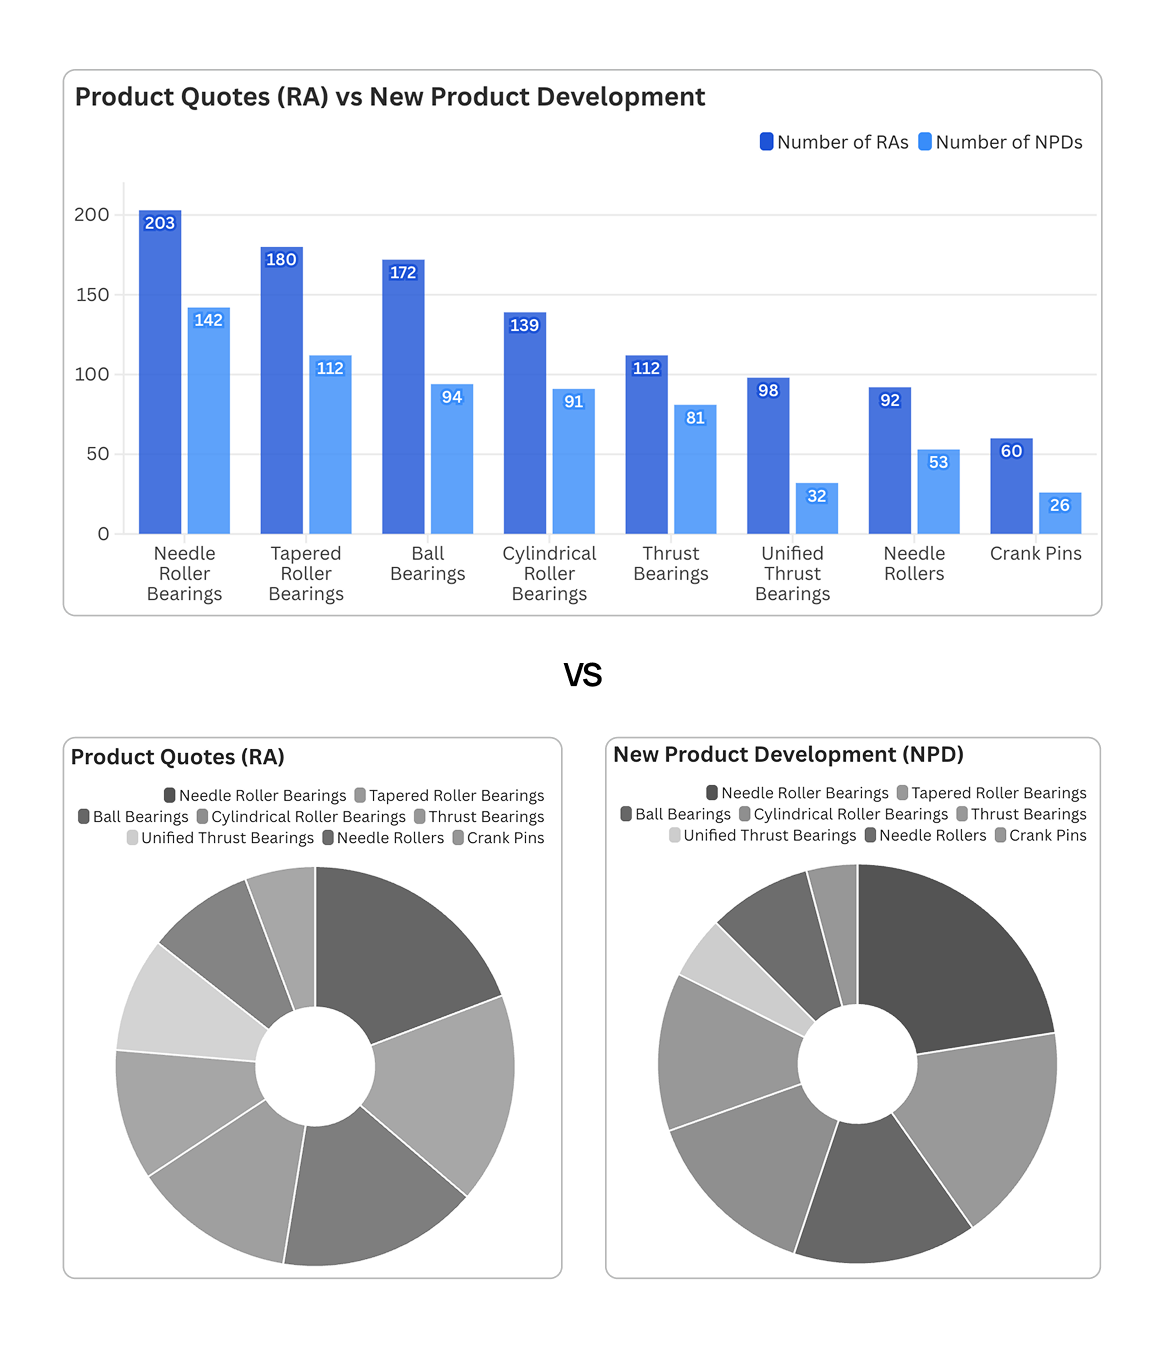
Grouped Bar vs. Pie Chart
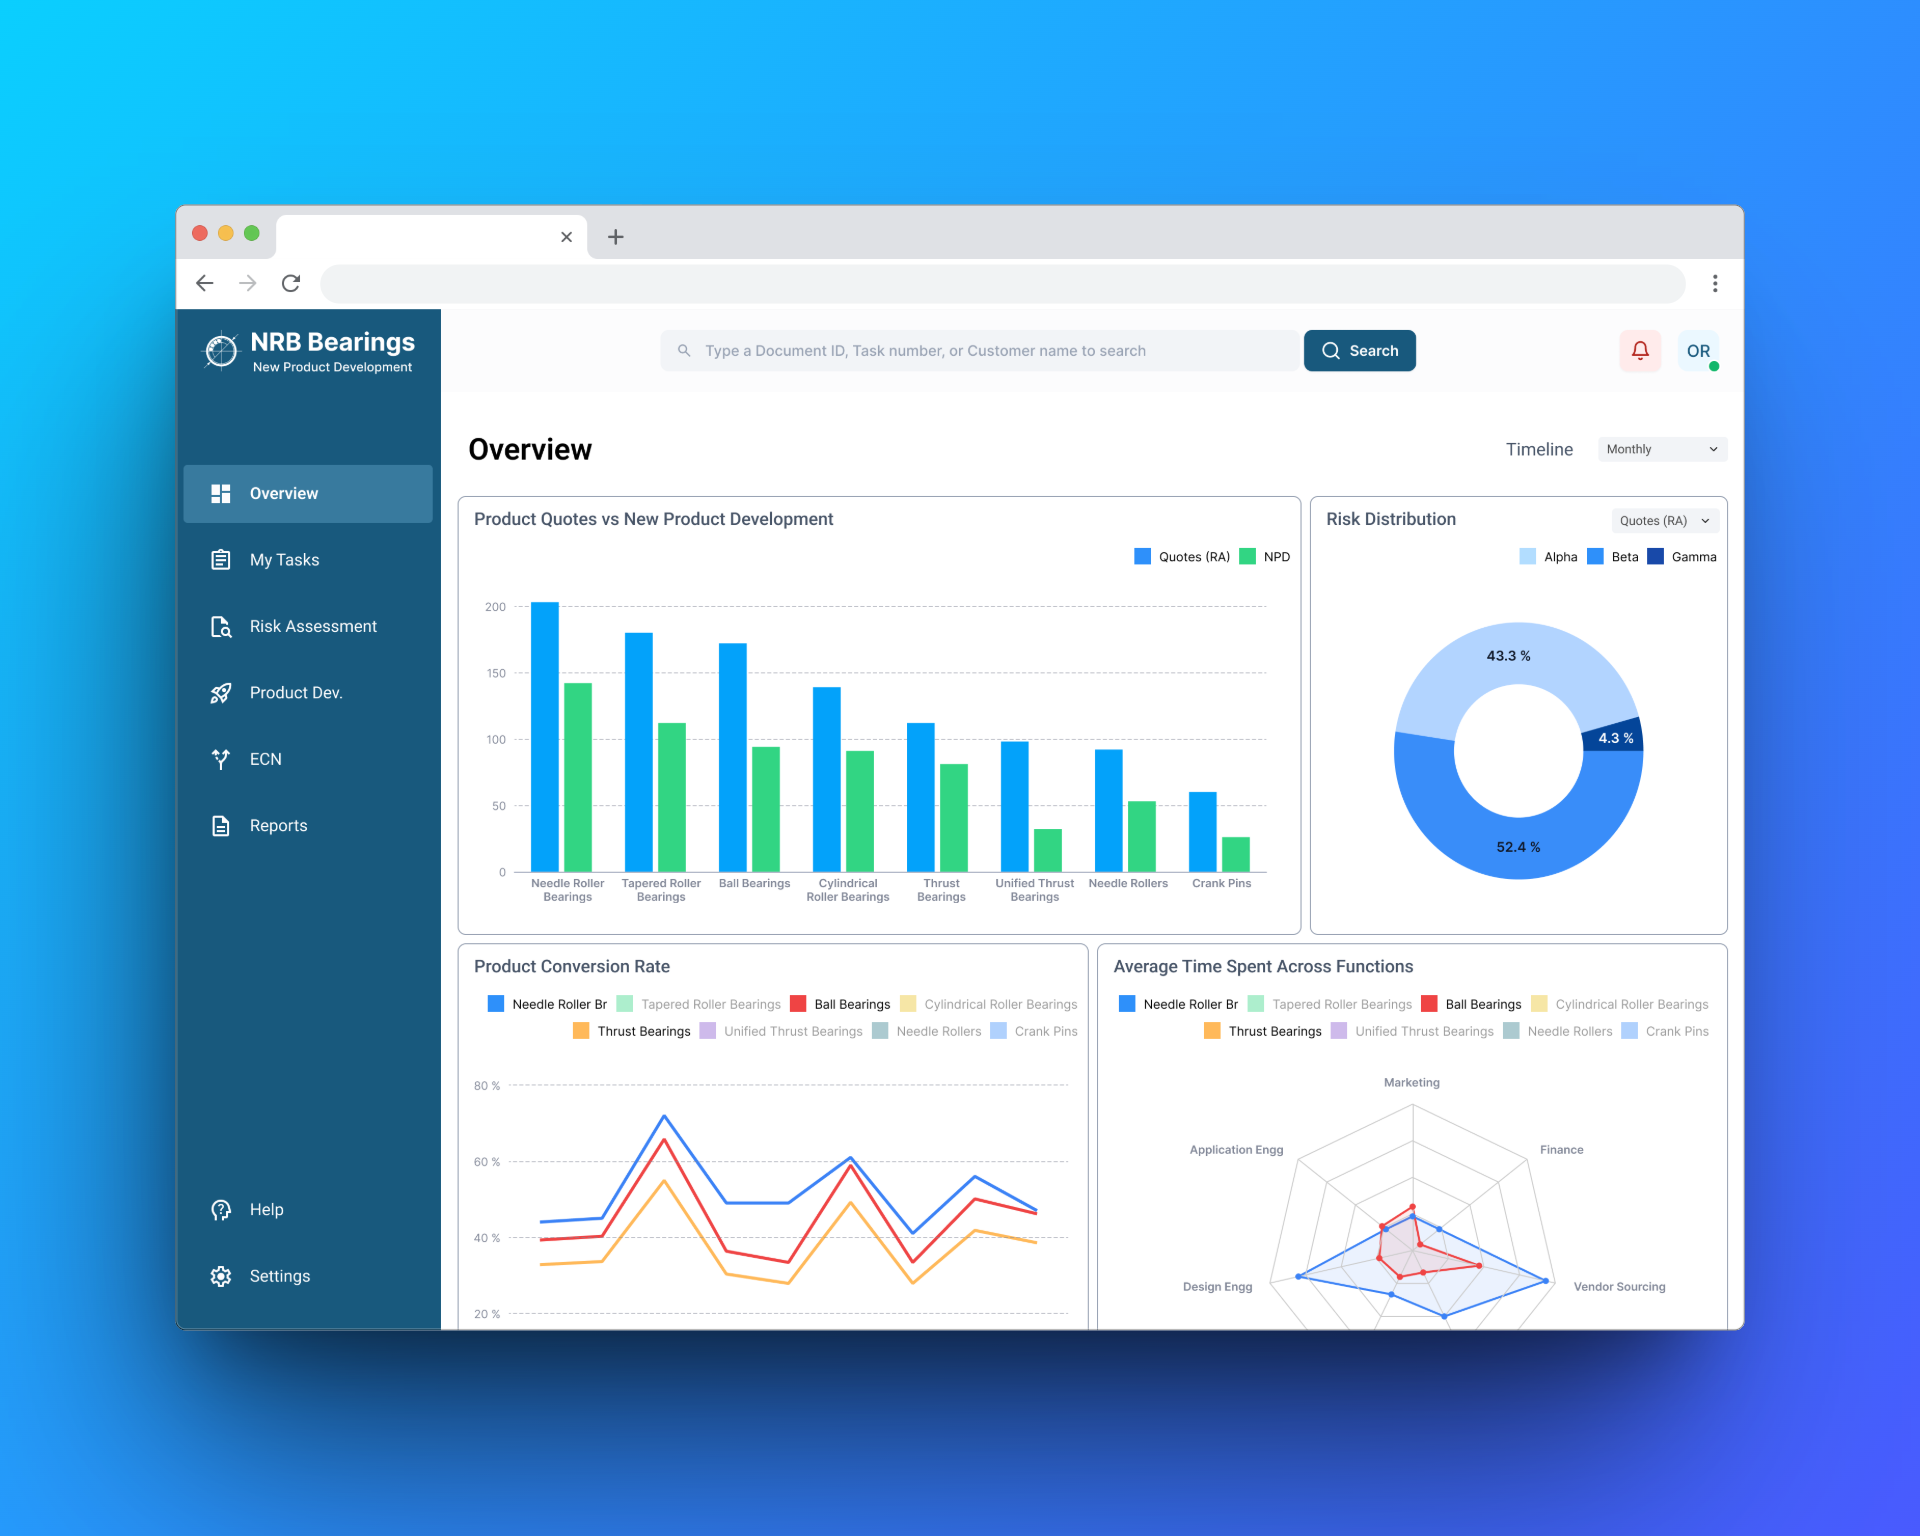
To compare quote volumes across product families, I chose a Grouped Bar chart over a Pie chart. It allowed users to view both total quotes and their conversion into NPDs in a single view. This made patterns clear at a glance. In contrast, the pie chart required switching views and made comparisons harder, increasing cognitive load.
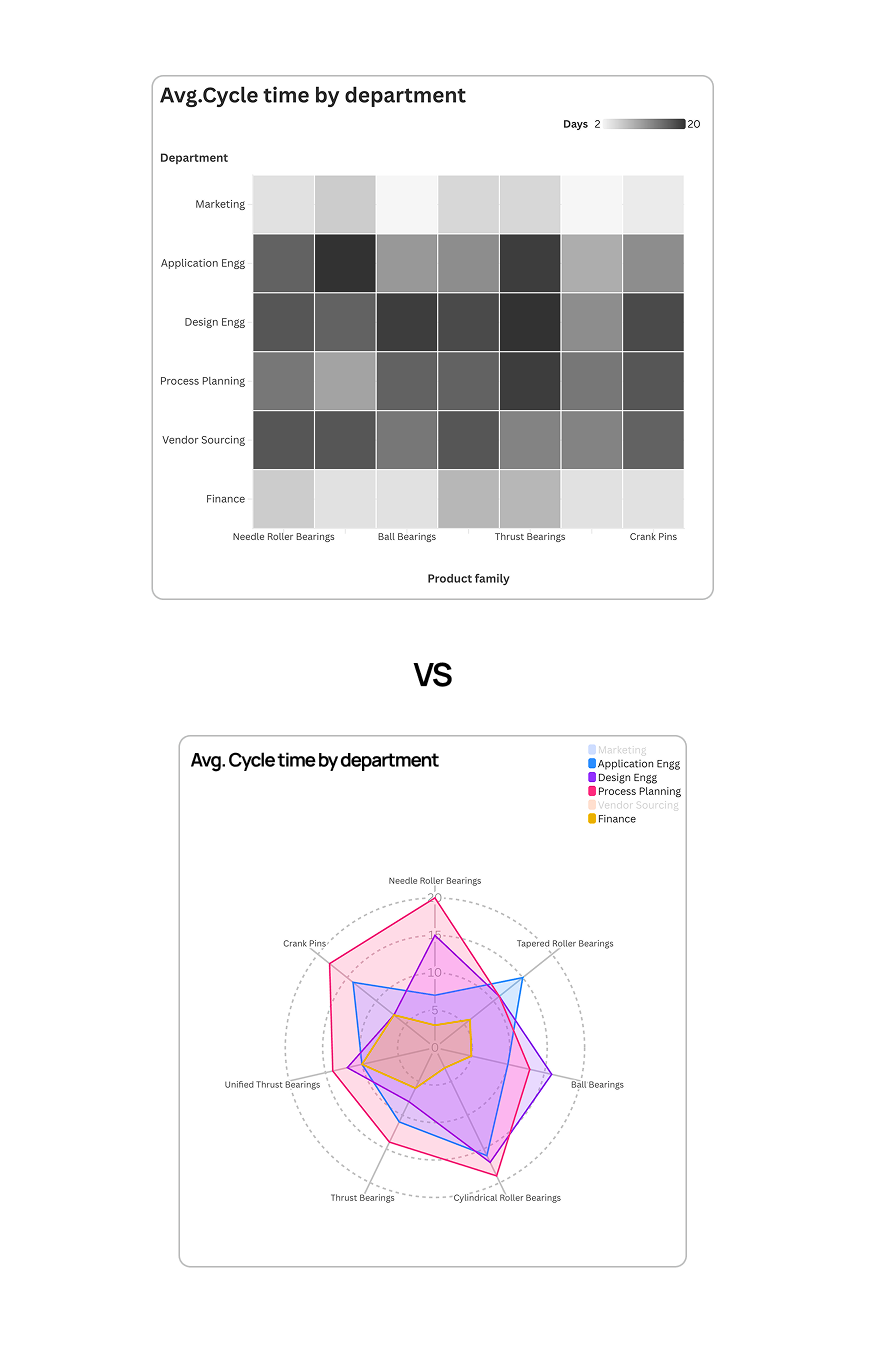
Radar Chart vs. Heatmap?
The Radar Chart scored higher in clarity and comparative insight. It made it easier to spot performance gaps across departments and visualize differences between product families in a single view.
In contrast, the Heatmap relied on subtle color shifts that were harder to interpret at a glance, especially when identifying outliers or deciding where to intervene. For quick pattern recognition and decision support, the Radar Chart proved more effective.
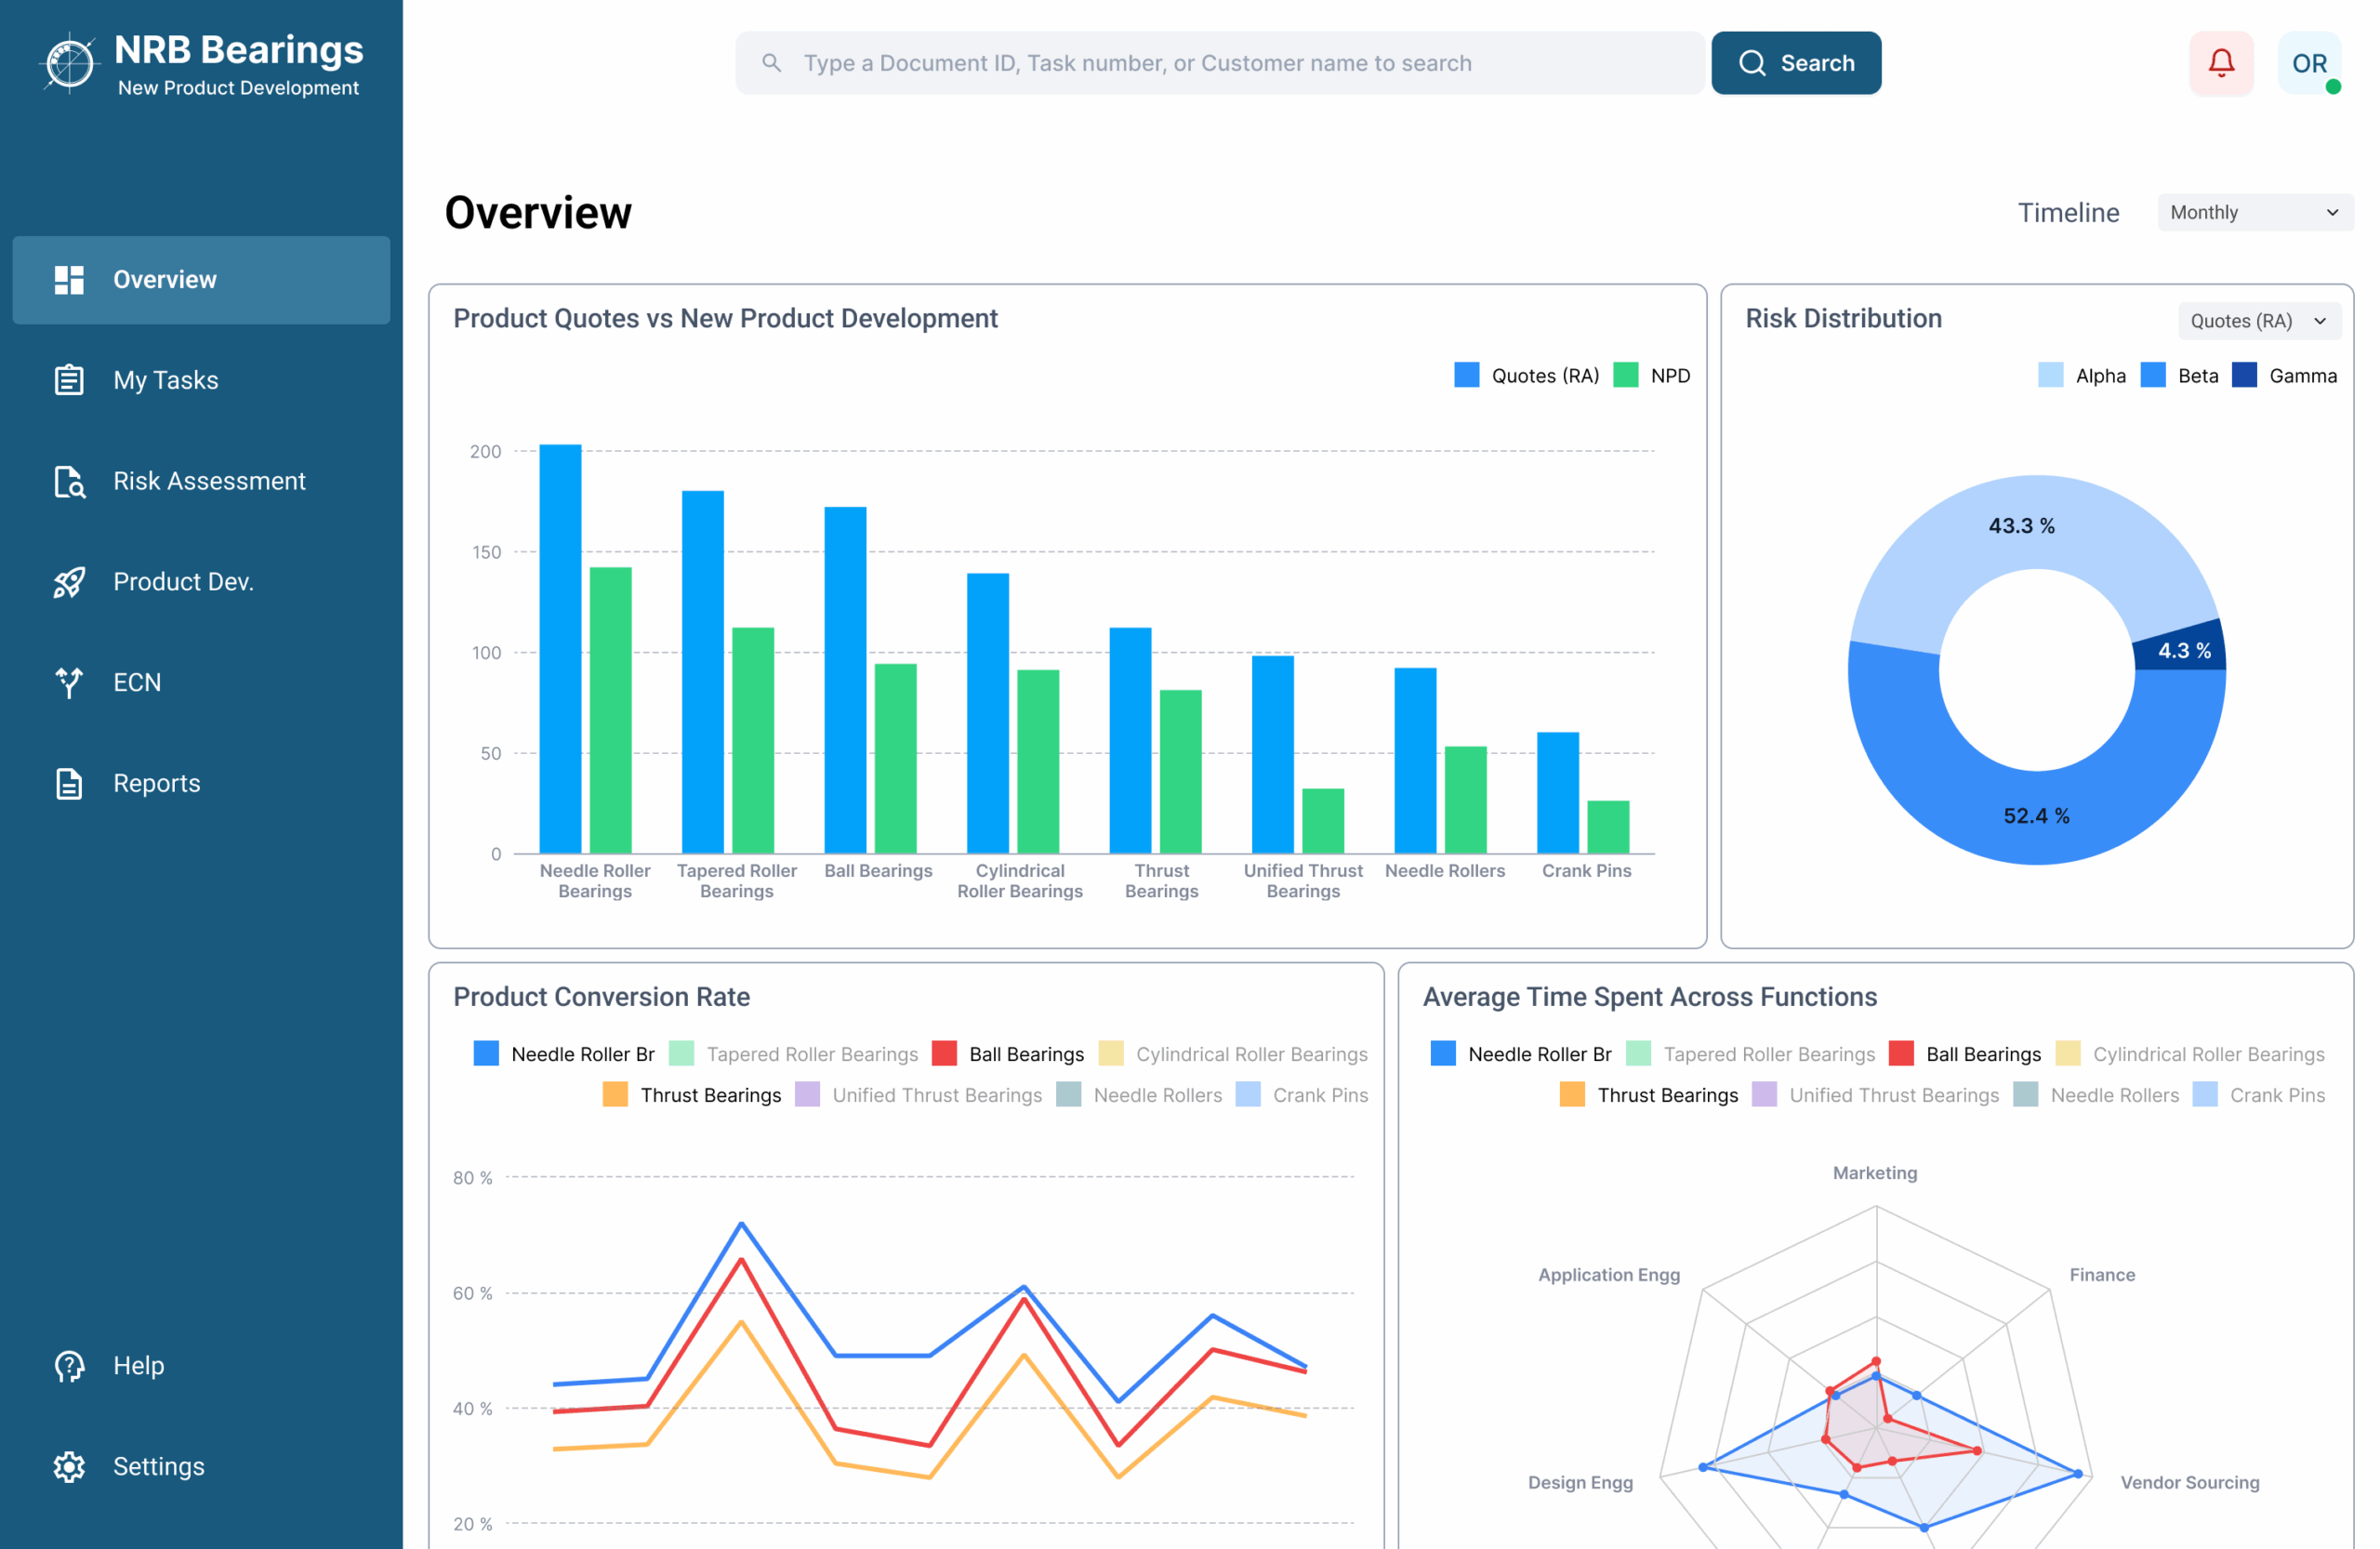
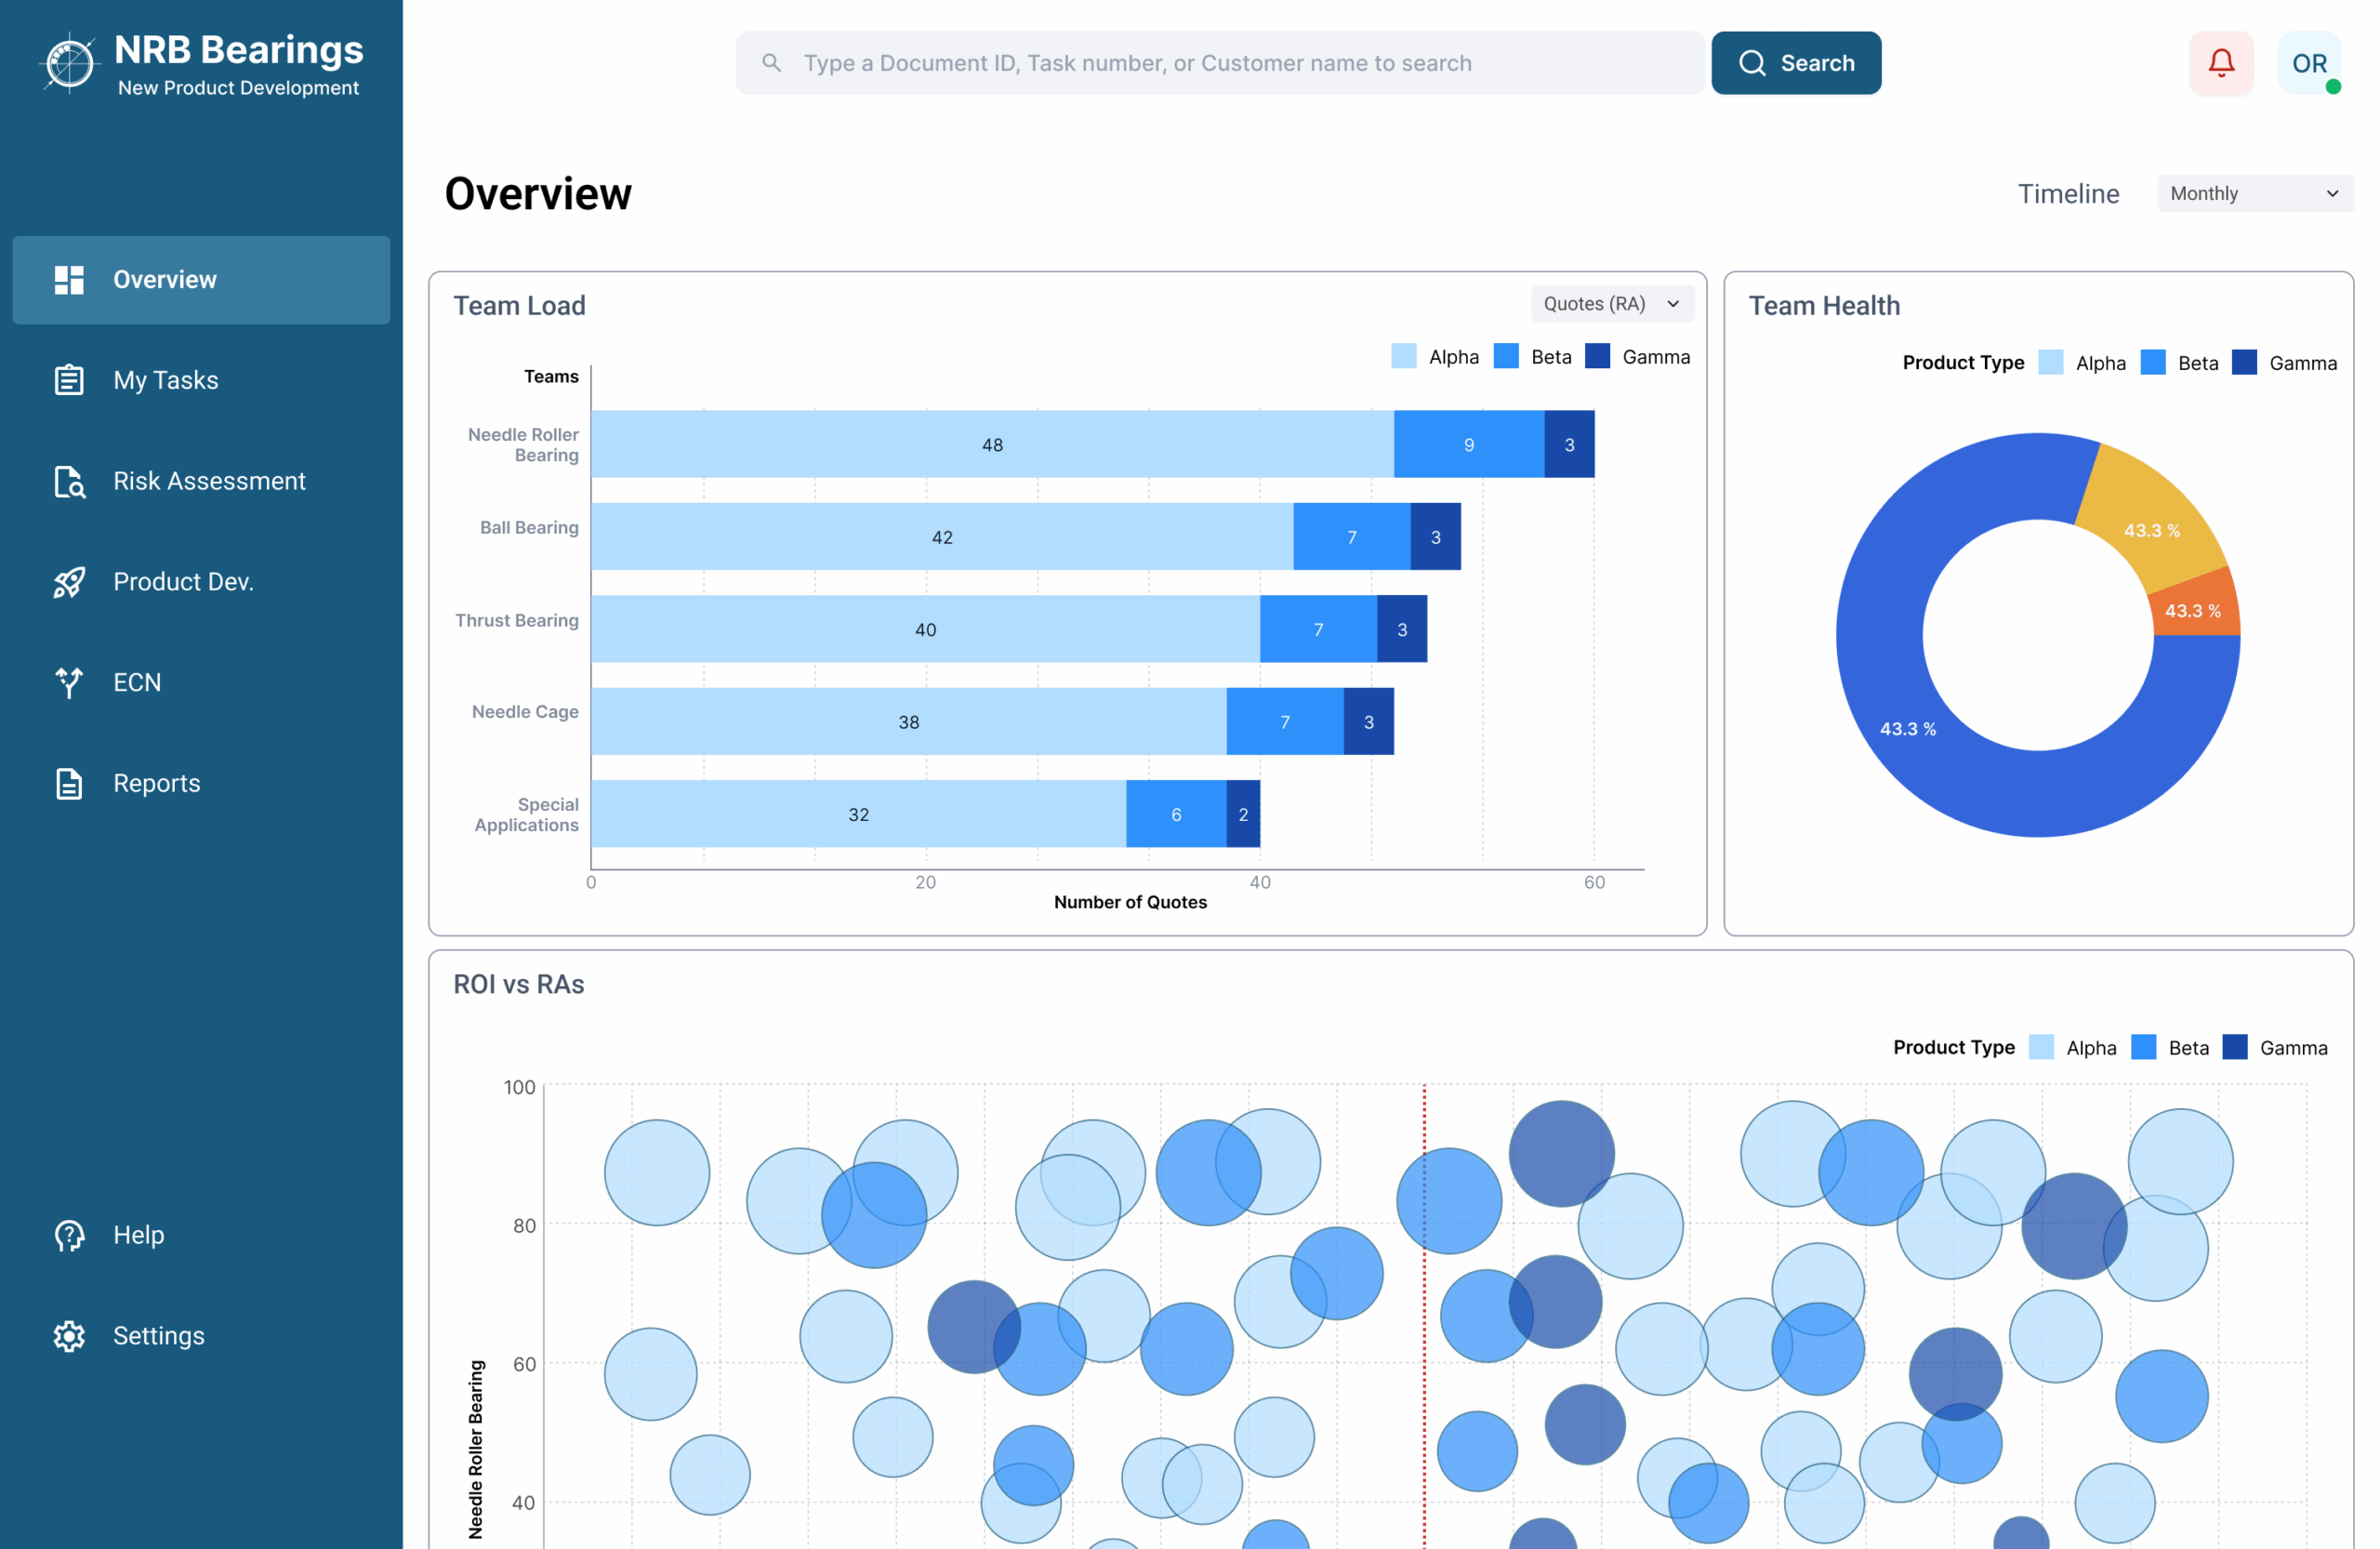
Final dashboards
Impact
The redesigned dashboards directly improved operational efficiency and decision-making:
56.3% increase in quotes processed by enabling teams to identify and act on high-priority requests faster.
32.6% reduction in lead times through early bottleneck detection and clearer accountability across departments.
26.4% overall business growth supported by better visibility into ROI, conversion rates, and resource planning
The design aligned execution with strategic priorities, giving leadership and teams the clarity needed to scale with speed and confidence.
Let's talk
© 2025 | varundinesh.com |
© 2025 | varundinesh.com |